文章段落
Operations 作業套件
自2016年 Google 發表了 Stackdriver 以來,這套工具提供了雲端服務使用者在 GCP 控制台上直接監測、除錯,改善應用程式的功能,使用者只需開啟 GCP 控制台, 這套工具觀測雲端資源的 dashboard 以及 log 記錄,方便做 troubleshooting 或是對 log 做更進一步的數據分析。而現在 Google 也更改了這項服務的名稱,以 Operations(作業套件)來統稱這項服務。
以下文章將為您介紹,如何設定 Operations 當中的 Cloud Monitoring 跟 Cloud Logging 服務去監測 Cloud Load Balancing 的 HTTP request 和 external ingress traffic。
Cloud Load Balancing
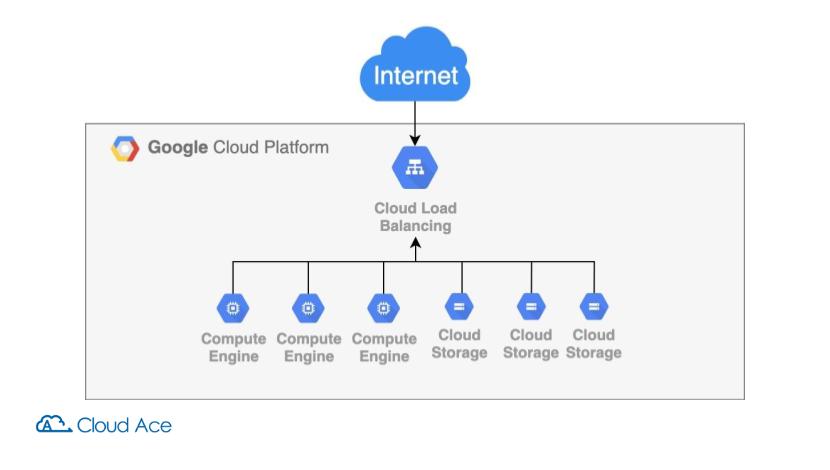
Cloud Load Balancing 是 GCP 的負載平衡服務,它具有可擴充性,不需要事先暖機,就可以自動將您的服務依照負載量的大小,適度調配到單一地區,或是全球多個地區的運算資源上。因此,您可以透過負載平衡適當地把流量有效分配給後端的伺服器,確保您的服務不會因為請求數量(request)過多造成服務中斷,導致回應請求的時間延遲。
分類選擇上, Cloud Load Balancing 依照網路流量類型,可分成 HTTP(S)、TCP 以及 UDP 三種不同的型態。而關於 Cloud Load Balancing 的其他功能介紹,我們之後有機會再來分享。
Cloud Logging 與 Cloud Monitoring
Cloud Logging 是 Operations Suite 中的一項全代管服務,不僅可以處理大規模作業,還能擷取 GKE 環境和 VM 的應用程式與系統記錄檔資料和自訂記錄檔資料。Cloud Logging 可讓您即時分析記錄檔,也可以匯出 log 到 Cloud Storage 做長期備份。因此, 我們可以使用 Cloud Logging 的功能去記錄 Cloud Load balancing 的 HTTP request ,讓雲端使用者可以做分析或是除錯。
Cloud Monitoring 則是一個可以讓您掌握雲端資源的效能、運作時間與整體健康狀態的服務。除了幾個選單中可以直接選取的服務監視數據以外,您可以依照 GCP 提供的指標(metrics)做設定 產生 dashboard 圖表。在監測 Cloud Load Balancer 時,我們可以將 Cloud Load Balancing 的指標顯示在圖表上觀察服務目前的流量,還可以針對指定的觸發條件產生告警訊息,讓使用者在發生問題的第一時間就能採取應變措施。
實作範例
以下 demo 一共分為兩個部分:
- 使用 Cloud Logging 記錄檔來記錄、觀察 External HTTP Load Balancer 的 HTTP request
2. 使用 Cloud Monitoring 製作 TCP Load balancer 的 dashboard 和 alerting
使用 Cloud Logging 觀察 External HTTP Load Balancer 的 HTTP request
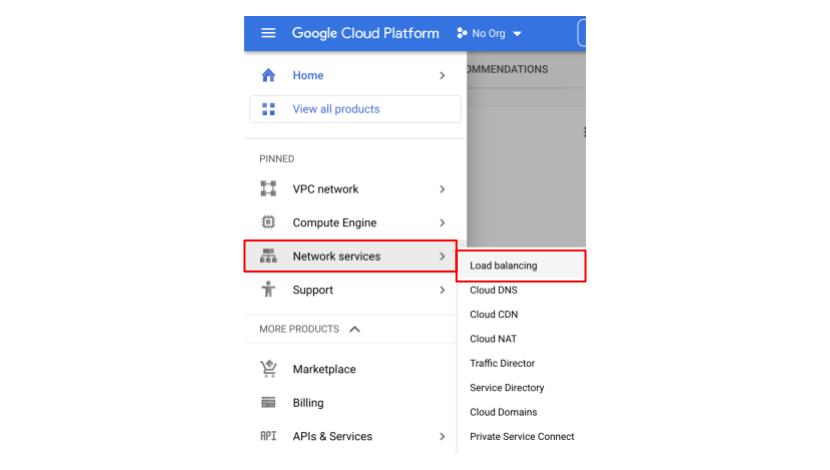
首先點進 HTTP Load balancer服務,從 GCP console 的選單中,找到 Network > Load Balancing。

截圖自:Google Cloud Platform Console 頁面
© 2022 Google
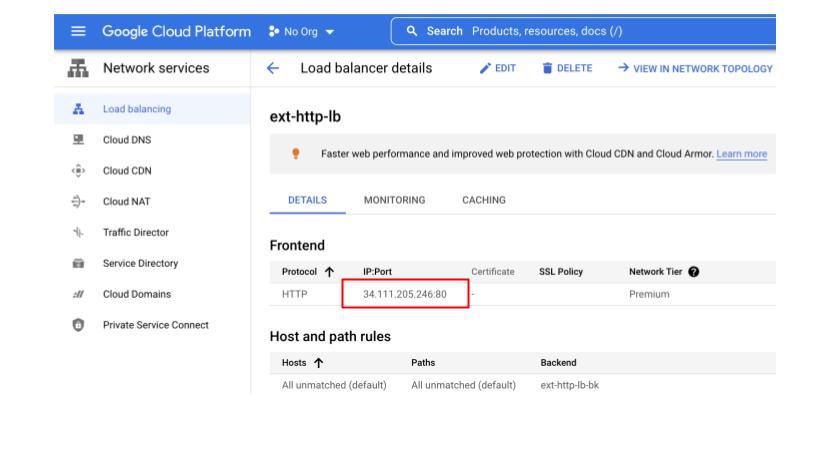
進入清單裡點選我們的 HTTP Load balancer 名稱,就會看到下圖中的 Details,在紅色框框處,我可以找到 34.111.205.246:80 這個負載平衡前端的 IP 地址,把它記下來,以便進行 HTTP request 的模擬測試。(測試產生 request 方法,可以使用 postman 工具,或是在瀏覽器網址列輸入 ip:port 前面加上 http:// )
© 2022 Google
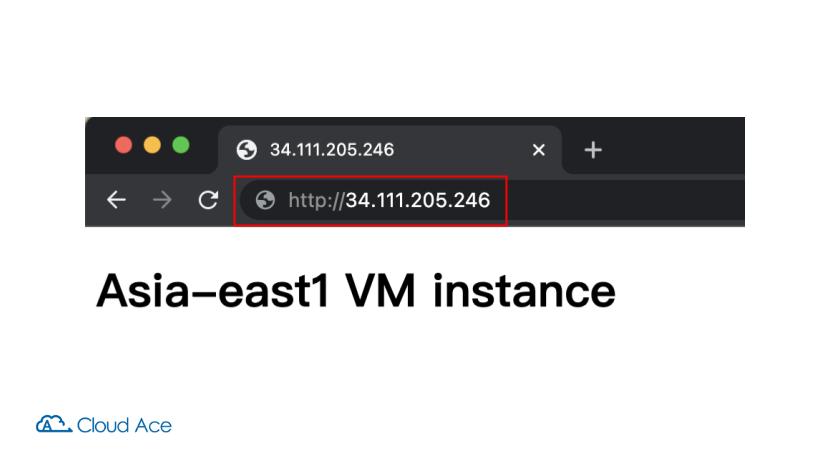
透過瀏覽器網址,我傳送了一些 HTTP request 給 Load Balancing。
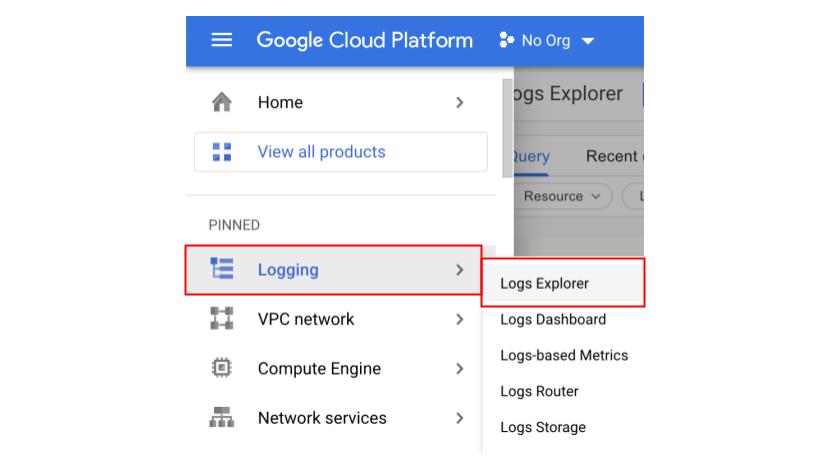
使用 Cloud Logging 觀察 Load Balancer 的 log 日誌。
回到 GCP 的工具列,我們找到 Logging >Logs Explorer 點選它。
© 2022 Google
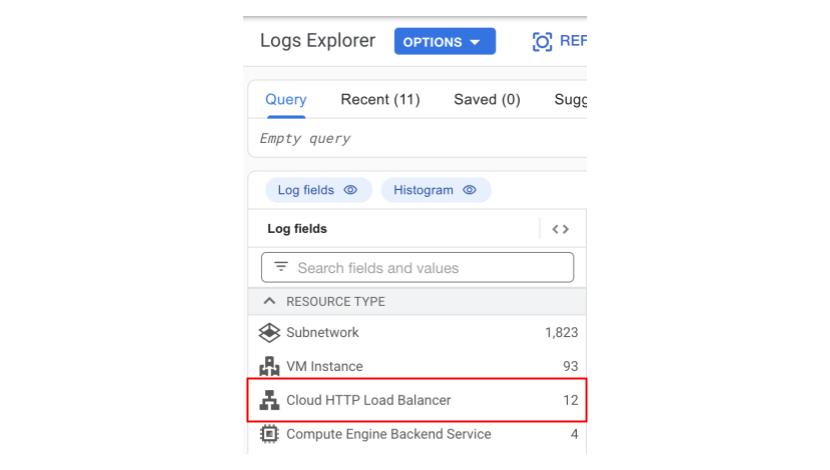
接下來,在下圖 Resource Type 中點選我們要查看的 Cloud HTTP Load Balancer。
© 2022 Google
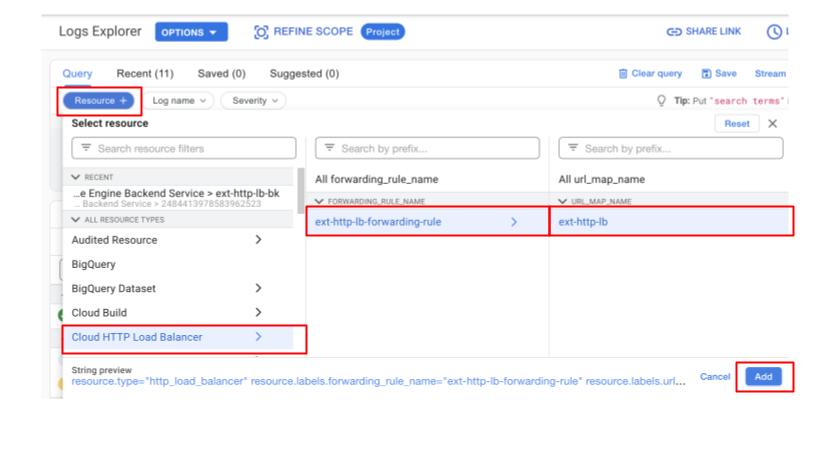
點選 Resource 依照下圖選擇你的 load balancer 並按下 ADD。
© 2022 Google
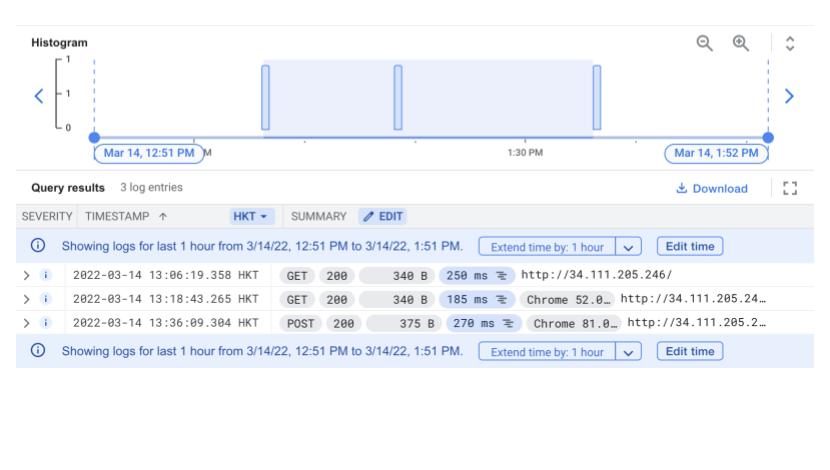
選完以後,過幾秒 Cloud Logging 就會出現以下畫面:
© 2022 Google
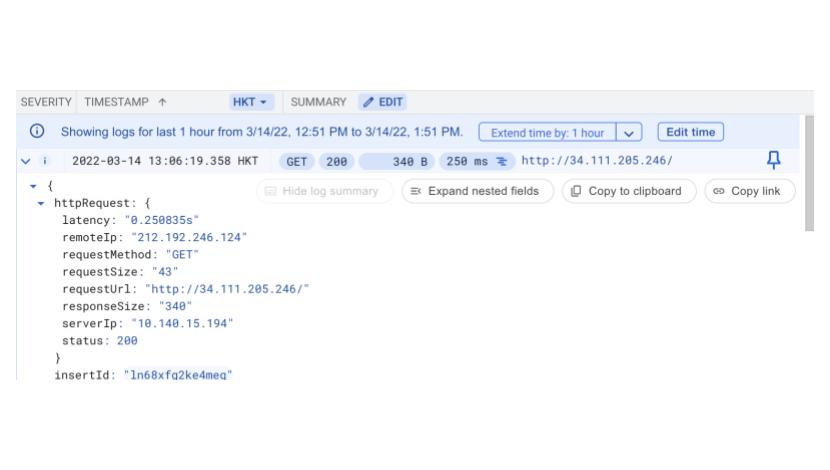
我們點開其中一筆紀錄來看看裡面的內容:
© 2022 Google
我們發現裡面真的記錄了 http Request,還有包含 remote ip、requestMethod、status、user agent 等資訊,Cloud Logging 也會把其他關於這個 request 的系統記錄寫在這筆資料中。
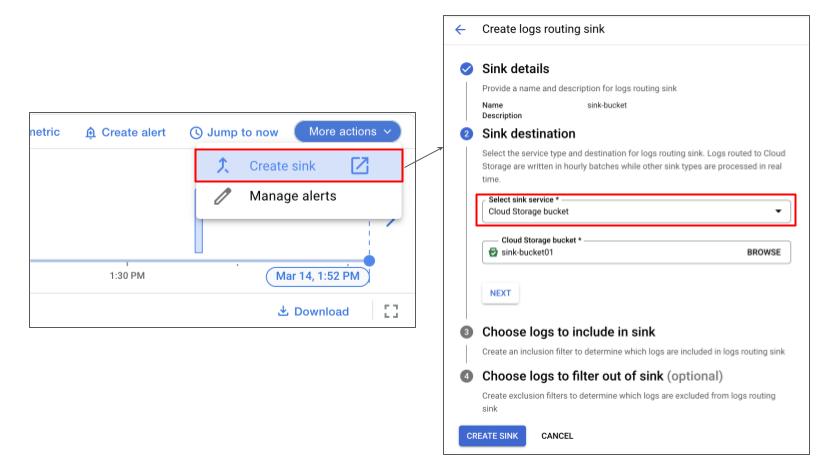
匯出 log:Create Sink
如果想匯出 log 保存,可以點選 More actions > CREATE SINK 進行 log 檔的同步備份。完成設定後,未來當新的 log 產生時,我們可以透過這個功能,把我們的記錄匯出到 Cloud Storage 儲存。
© 2022 Google
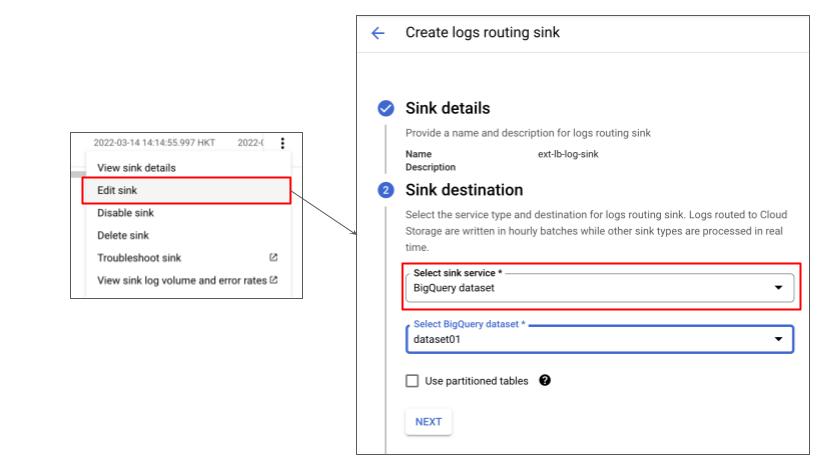
如果要進一步下 SQL 指令進行分析,可以從 Edit Sink 選擇 Sink Destination,把資料匯出到 BigQuery 進行進一步的分析。
© 2022 Google
利用 Cloud Monitoring 製作 TCP Load balancer 的 dashboard 和 alerting
第二個實作範例,我們會實作一個 TCP Load Balancer,並設定 Cloud Monitoring 的 metric 產生監測圖表,以及示範如何設定告警訊息。
產生新的 External TCP Load Balancer
打開 GCP 控制台,在工具列的選單再次選擇 Network > Load Balancing。
© 2022 Google
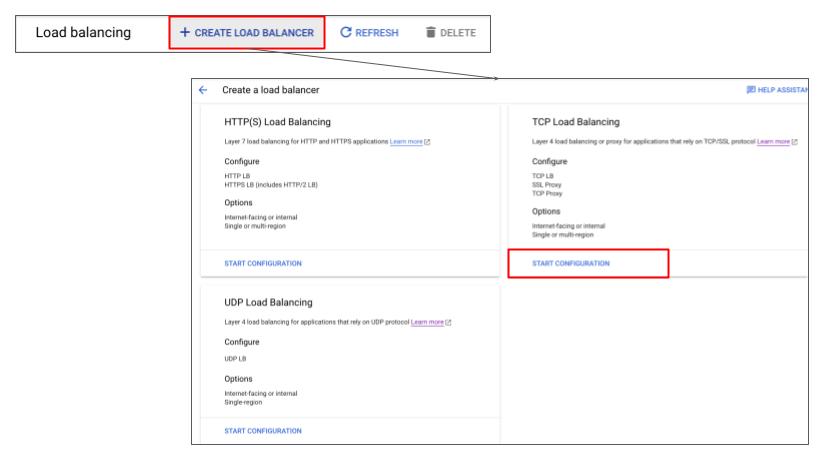
接下來在選單中點選 +CREATE LOAD BALANCER。選擇 TCP Load Balancing 底下的 Start configuration,開始進行 TCP Load balancer 的設定。
© 2022 Google
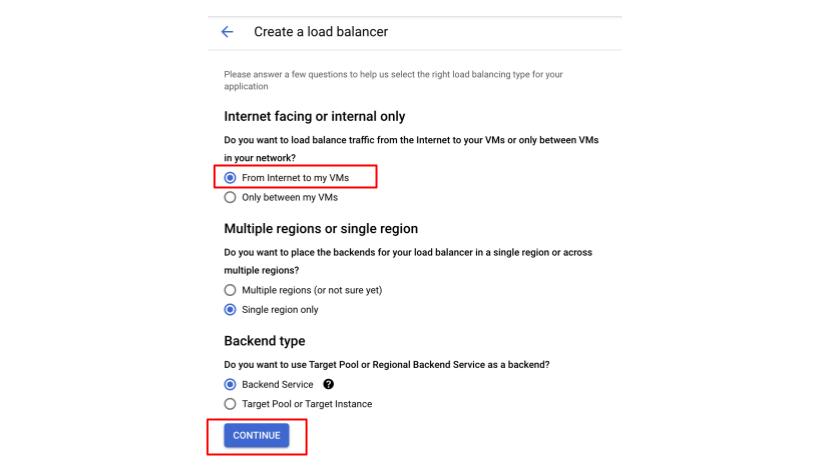
因為我們要接收外部的 traffic,所以在這個頁面裡中要點選 From Internet to my VMs,接著按下 Continue 繼續。
© 2022 Google
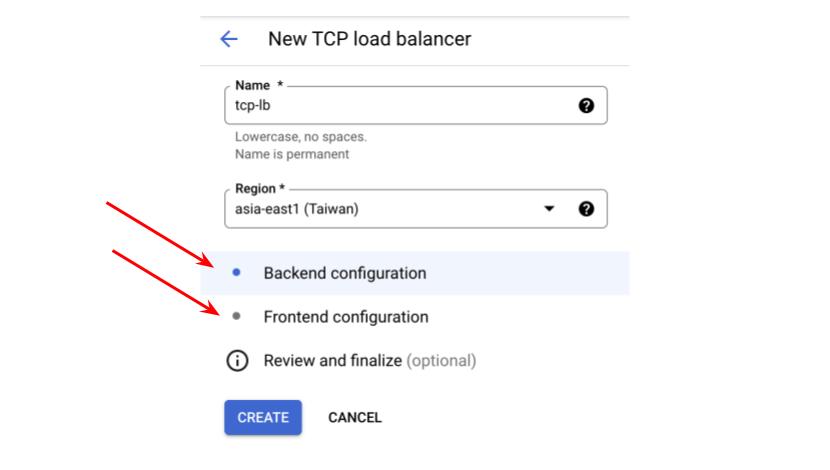
進入 New TCP load balancer 的 Configuration 設定畫面後我們可以發現 TCP Load Balancer 的設定分為兩個部分:前端跟後端的 Configuration。
© 2022 Google
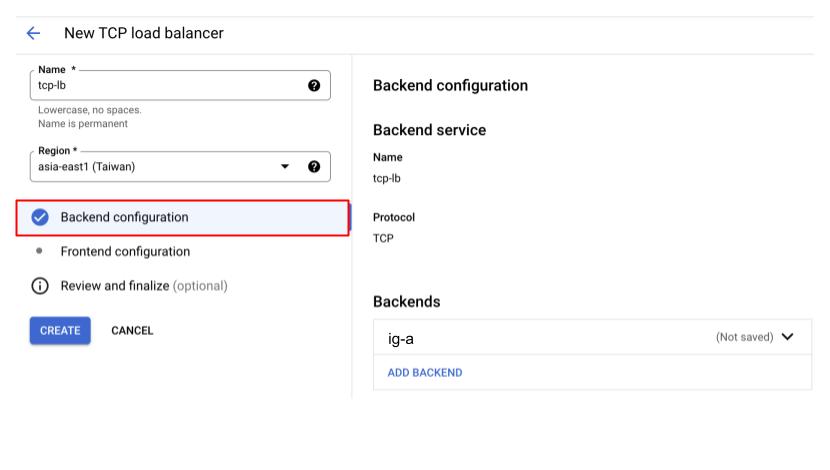
接下來,點選下圖中紅框裡的 Backend Configuration 參考右邊的設定來完成後端服務的設定。
© 2022 Google
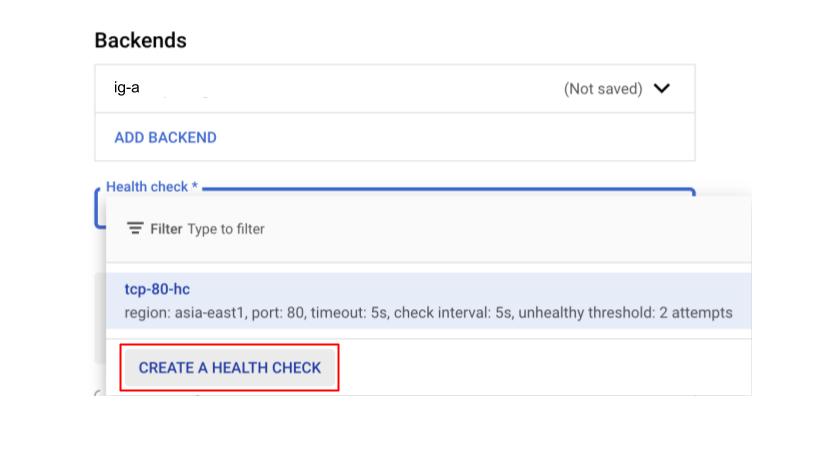
其中 Health Check 的地方,我們需要進行一些設定。將選單下拉,選擇 CREATE A HEALTH CHECK。
© 2022 Google
Health Check 的設定方式,可以參考下圖:
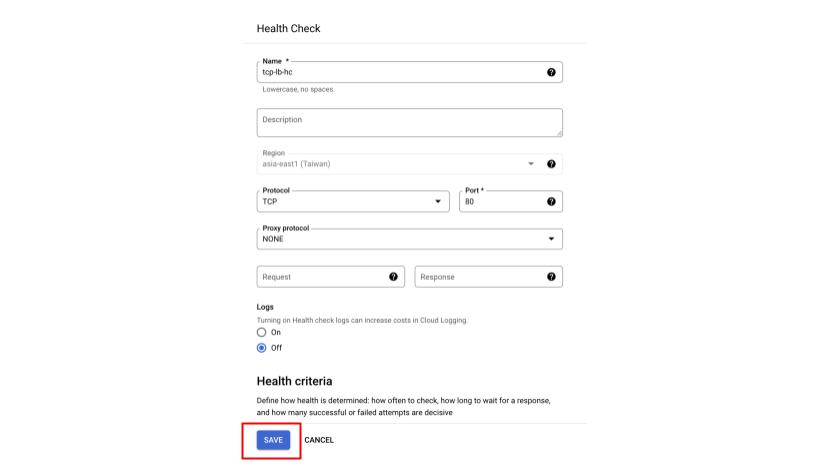
© 2022 Google
按下 Save,儲存設定。接著回到 TCP Load Balancer 設定畫面,點選紅框中的 Frontend configuration。
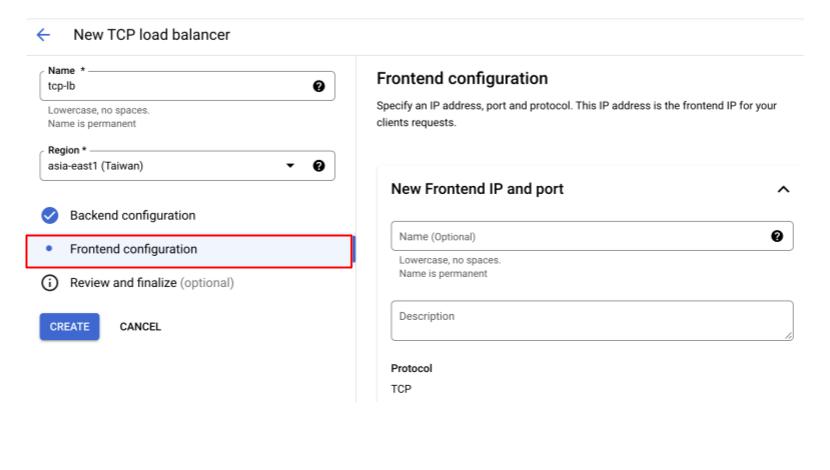
© 2022 Google
使用以下設定,點選 Done,完成設定。
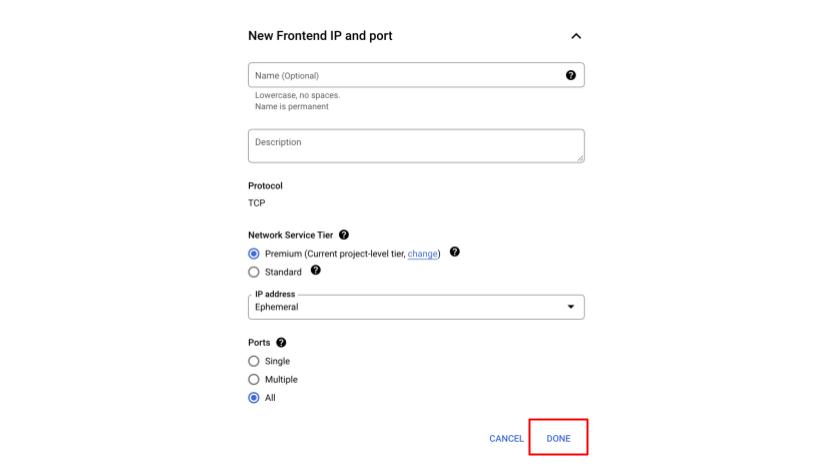
© 2022 Google
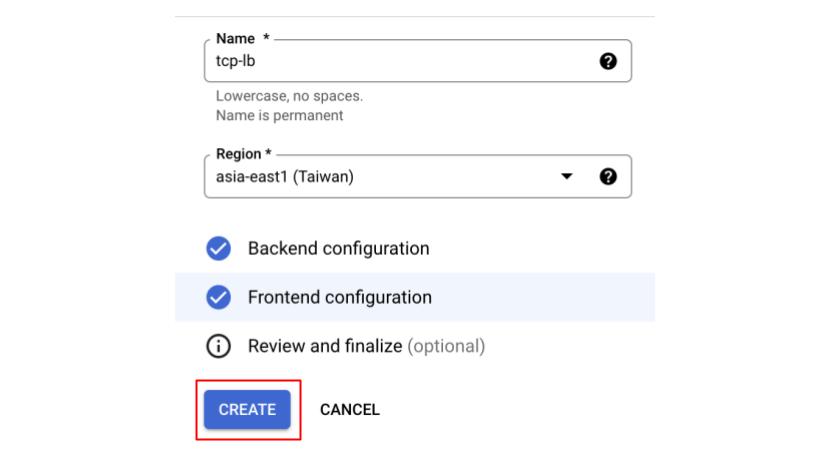
Backend 跟 Frontend 如果都完成設定,畫面中就會出現兩的藍色的勾勾,如同下圖所示。按下 Create 新的 TCP Load balancer 就會產生。
© 2022 Google
在 Cloud Monitoring 產生新的 dashboard
接下來請打開 GCP 工具列找到 Monitoring ,點選 Dashboard。
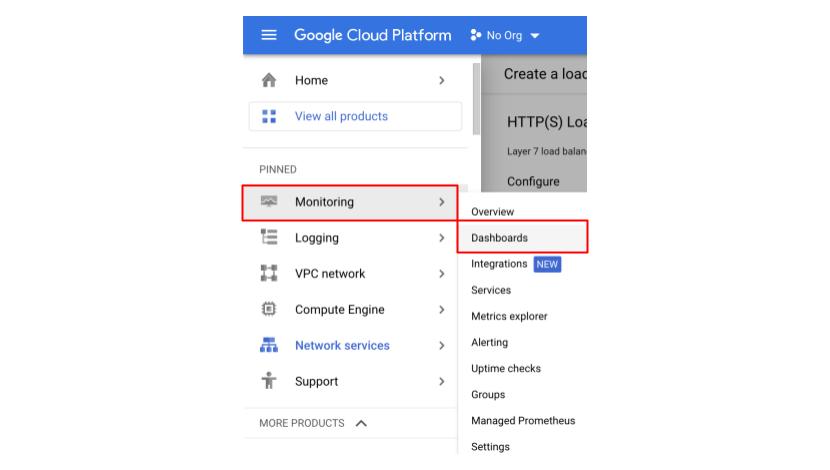
© 2022 Google
點選在畫面上方的 +Create Dashboard,產生一個新的 Dashboard。
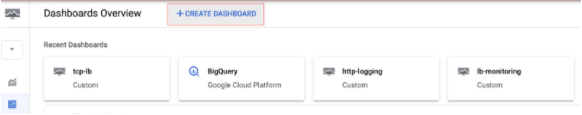
© 2022 Google
為這個 Dashboard 取名,接著點選下圖中紅框內的 ADD CHART。
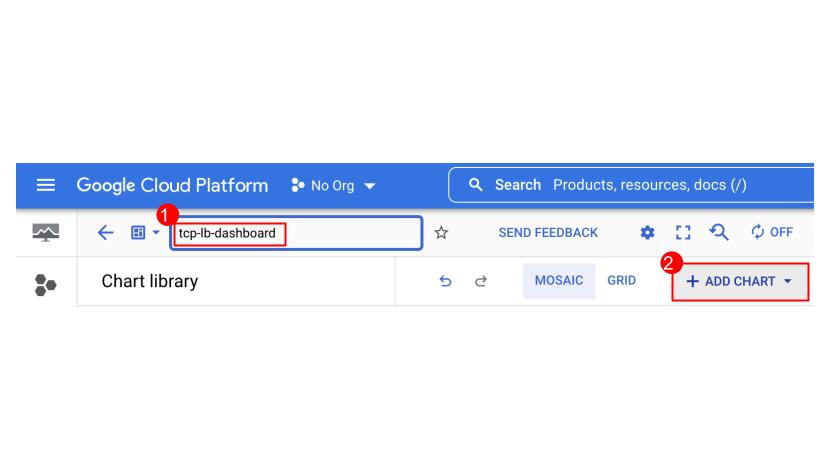
© 2022 Google
設定監測指標(metrics)
設定指標前,我們先從官方文件當中找到 GCP 提供使用 Monitoring 功能時可以設定的指標清單。文中有針對指標的類型、用途做詳細的說明,我們從清單中選取以下兩個指標當作圖表呈現的內容:
首先要新增的第一個指標可作為監測 TCP 外部 ingress 的流量進入後端服務的計數器。
新增指標一:
https://loadbalancing.googleapis.com/l3/external/ingress_bytes_count
接著要新增的第二個指標則是可作為監測 TCP 外部 ingress 的封包送入後端服務的計數器。
新增指標二:
https://loadbalancing.googleapis.com/l3/external/ingress_packets_count
再來我們進入 ADD CHART 的設定畫面,在 Chart Title 為圖表命名,接著點選下面寫著 METRIC 的字樣,在 Find resource type and metric 的地方,貼上以下內容:
loadbalancing.googleapis.com/l3/external/ingress_bytes_count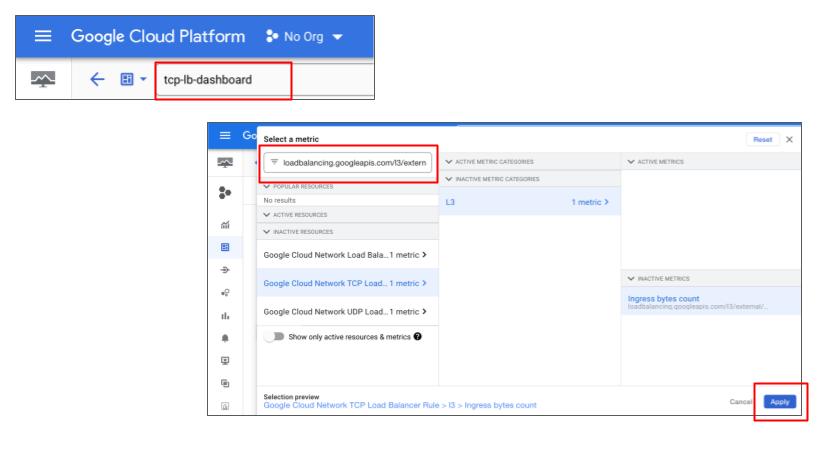
© 2022 Google
新增完第一個指標後繼續新增第二個指標。點選 +ADD METRIC 並在 Find resource type and metric 貼上以下內容:
loadbalancing.googleapis.com/l3/external/ingress_packets_count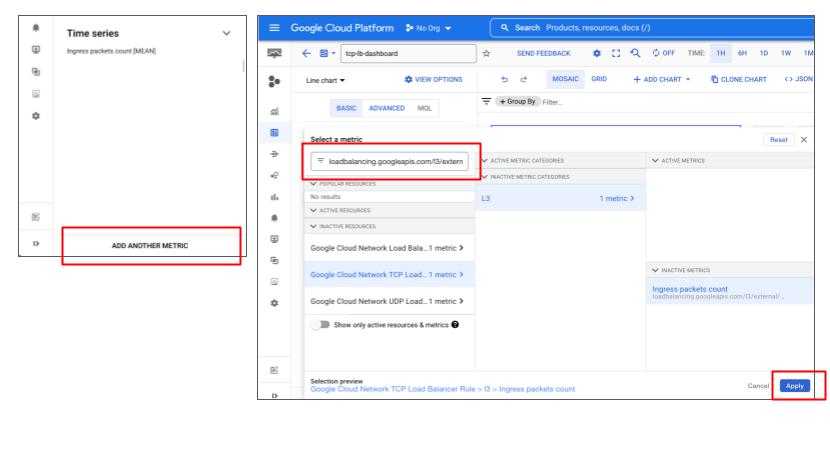
© 2022 Google
模擬流量產生,進入 TCP Load balancing 的應用程式
一開始沒有進來流量的時候,圖表不會產生內容,因此,我們可以使用 siege 工具來模擬外部流量進入 TCP Load balancing 情況,再來觀察圖表中 ingress 流量以及封包數的變化。
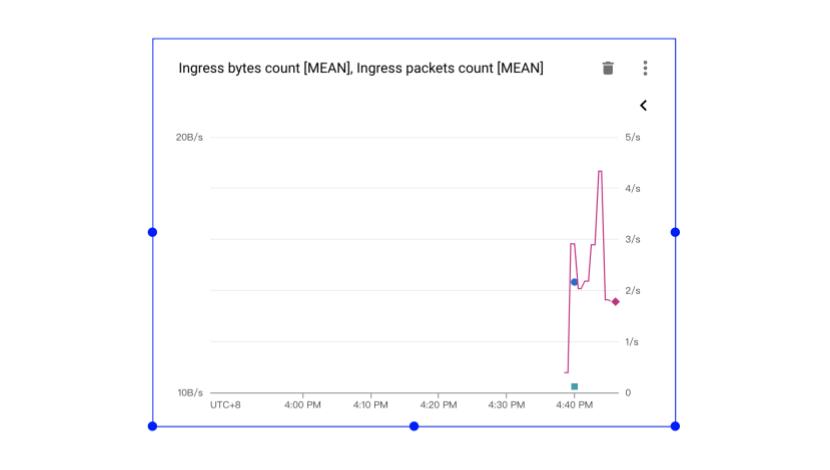
© 2022 Google
當流量成功進入 TCP Load balancer 的後端服務時,Cloud Monitoring 的圖表數值就會產生變化。
設定告警政策(Alerting Policy)
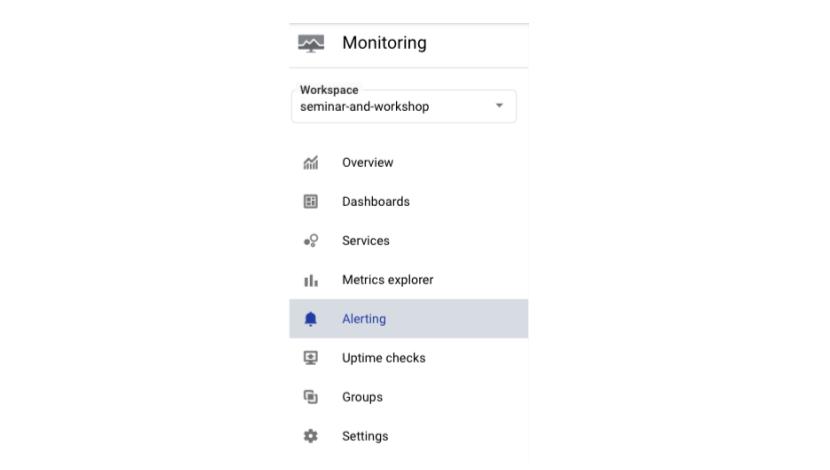
在 Cloud Monitoring 介面左邊的功能列,點選 Alerting。
© 2022 Google
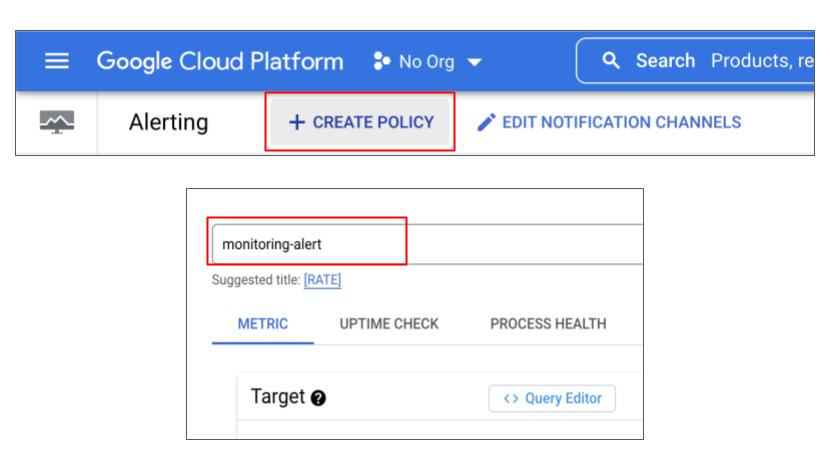
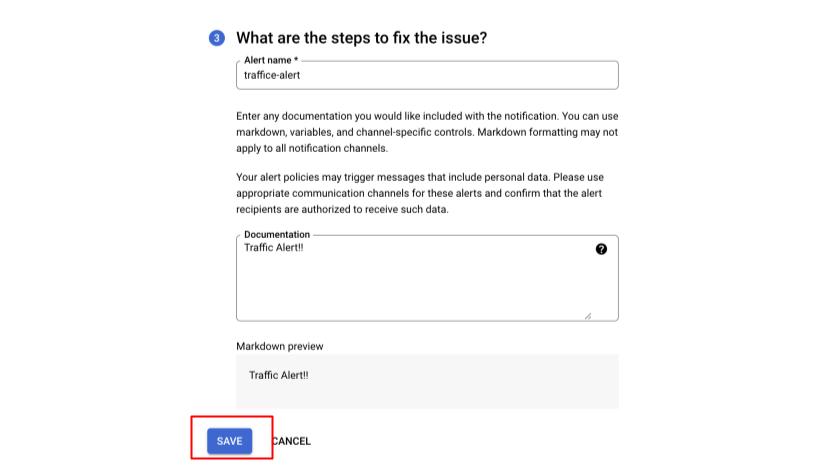
接著點選在畫面上方的 + CREATE POLICY,進入 CREATE POLICY 的畫面以後,我們先在幫它取一個名字,新增告警政策。
© 2022 Google
我們先為這個告警條件取個名字,接著到 Target 項目中 Find resource type and metric 的地方,輸入下方指標後點選 Select a resource。
loadbalancing.googleapis.com/l3/external/ingress_bytes_count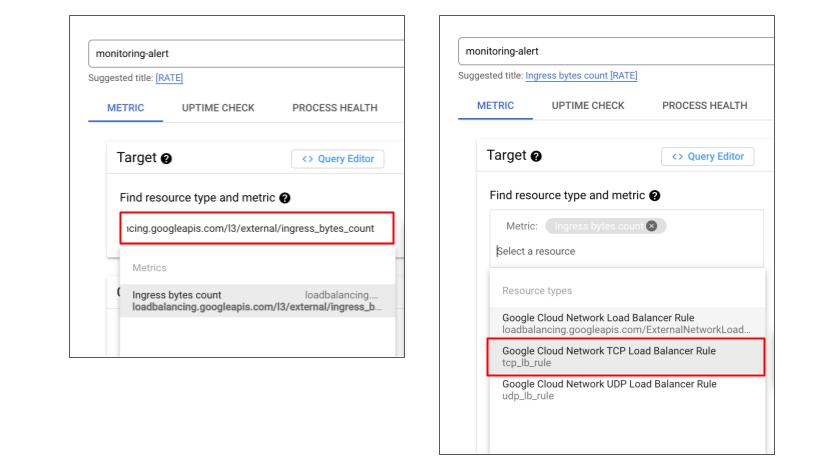
© 2022 Google
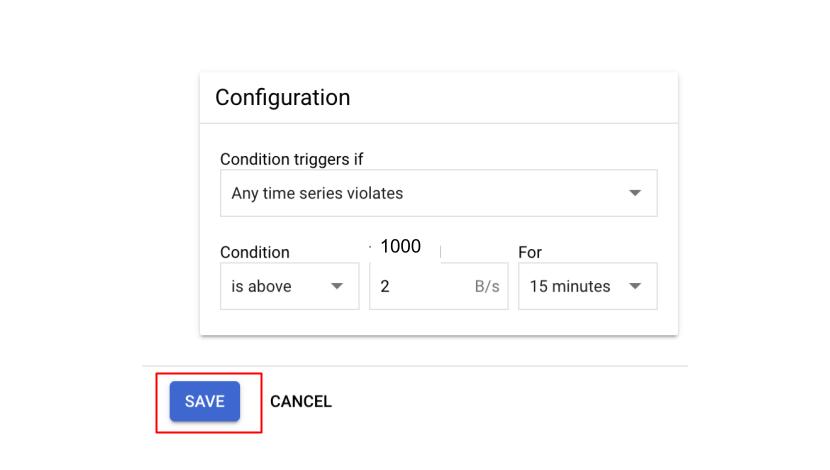
這個設定的用意,是要使用 TCP ingress 的流量作為告警政策的指標依據。而設定完 Target 以後,我們可以使用 Configuration 來設定告警發生的時機,請參考以下設定:
© 2022 Google
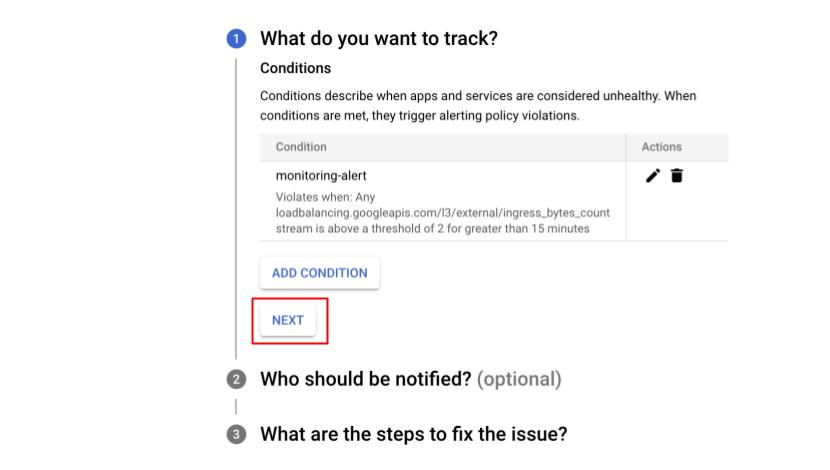
這個設定代表的意思是「任何時間,只要流量高於 500 KB 且狀況持續超過 15 分鐘,則警告將被觸發」。而設定好 Configuration 後,按下畫面底部的 SAVE 就完成新增告警條件。
接著,畫面會再回到新增告警政策的地方,按下 NEXT。
© 2022 Google
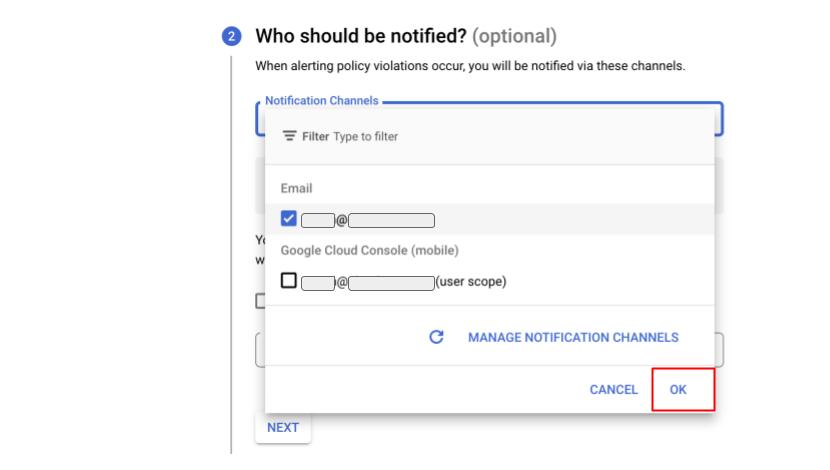
設定告警通知傳送到的目的地,這邊我們選擇透過 Email 傳送告警通知到應用程式擁有者的信箱。選擇信箱地址後按下 OK,畫面會再回到新增告警政策的地方,按下 NEXT。(您也可以在 MANAGE NOTIFICATION CHANNELS 修改設定。)
© 2022 Google
所有告警政策設定完成,按下 SAVE 儲存。
© 2022 Google
如果設定告警有成功觸發條件時,你的信箱裡就會收到像這樣的信件通知:
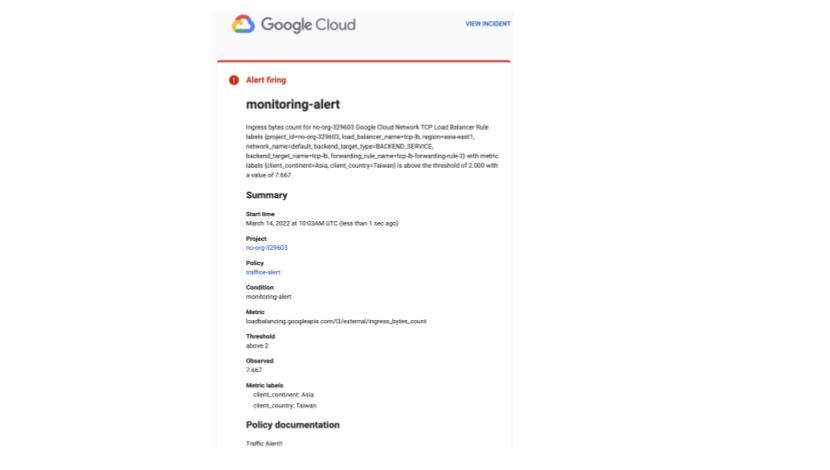
© 2022 Google
總結
GCP 的 Operation Suite 其實提供了非常多樣的服務,本篇只有針對最常見的 logging 以及 monitoring 示範,目的就是想讓讀者可以透過實作去了解您在 GCP 上面的資源可以如何去結合 Operations suite 監控跟除錯的功能,達到進一步的優化,以及障礙排除的目的。未來在設定其他 GCP 資源的監控機制時,可以更快上手。
以上就是 Operations Suite 跟 Cloud Load Balancing 的實際應用分享,如果各位對我們的介紹有興趣,或是想進一步了解 GCP 的架構應用,歡迎與我們聯繫!