
文章段落
如何落實 ESG 以實踐企業永續發展是一大趨勢,而如何精準掌握碳排放量更是整理 ESG 資訊的一大難題。但透過 Google Cloud 的 Carbon Footprint,我們可輕鬆掌握碳排放量,搭配上 BigQuery 後,更可讓 Looker Studio(原 Google Data Studio) 或 Google Sheet 同步當中的資料,降低企業達到永續發展的成本。
Google Cloud 如何協助企業輕易落實 ESG?
Google 一直視永續發展為核心價值並積極落實。為實踐永續發展,Google 旗下的 Google Cloud 除了提供100%的潔淨能源與高效率的資料中心,更訂出要在2030年前達成所有資料中心與雲端區域皆24/7,以100%無碳能源營運的目標。而除了以100%無碳能源營運的10年目標,Google Cloud 更推出了包含 Active Assist 和 Carbon Footprint 等工具在內的 Carbon Sense 套件,讓企業能透過更實際的行動落實 ESG 並達到永續發展。下面就來一起了解 Carbon Footprint 的功能與應用方式吧。
透過 Carbon Footprint 落實 ESG
設定 Carbon Footprint 權限需求
要使用 Carbon Footprint,首先我們需設定有關 Carbon Footprint 的權限,而它所需的 IAM 權限如下方表格所示。
| 功能 | 權限 |
| 查看計費帳戶的 Carbon Footprint | billing.accounts.getCarbonInformation |
| 可以列出計費帳戶並查看 Carbon Footprint 的資料 | (角色:roles/billing.carbonViewer) billing.accounts.list billing.accounts.get billing.accounts.getCarbonInformation |
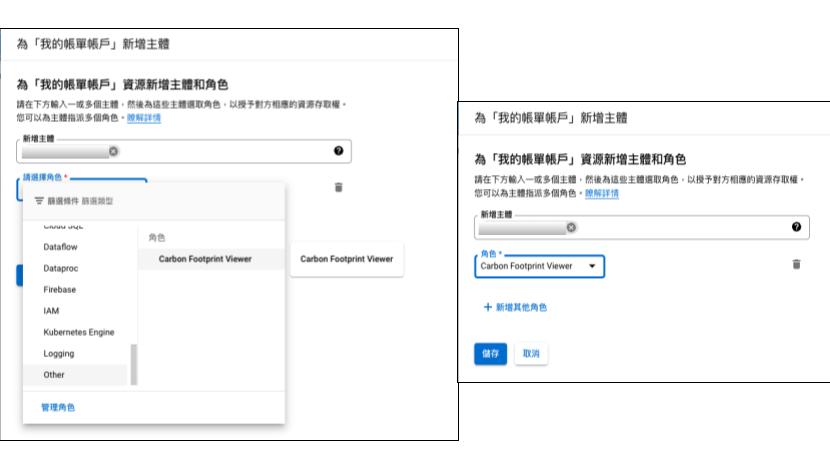
如要導出資料到 BigQuery 以查看明細,需有 billing.accounts.getSpendingInformation 權限,而此權限可套用的 IAM 角色包含 Carbon Footprint Viewer(roles/billing.carbonViewer)及 Billing Account Viewer(roles/billing.viewer)。下圖為賦予其他人導出權限的範例。
©2022 Google Inc.
查看 Carbon Footprint 數據
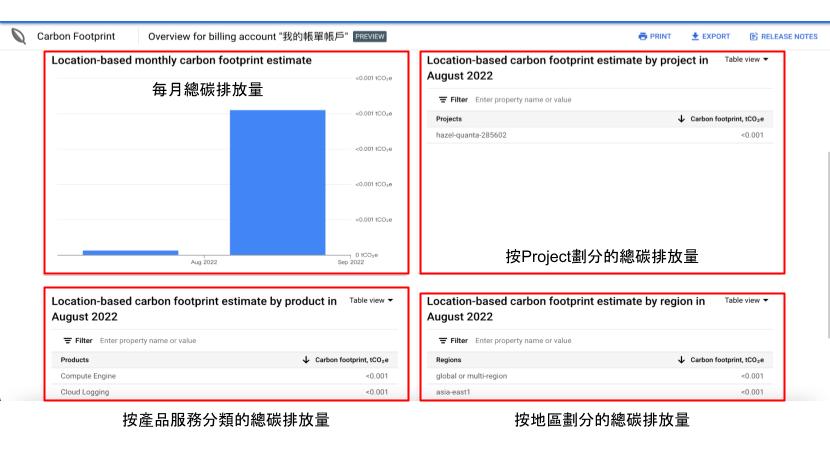
Carbon Footprint 會自動為計費帳戶計算數據,無需啟用或設置 API ,但需設置權限且上個月的數據最多要 21 天才會產生。如果擁有適當的 IAM 權限並已產生數據,則數據會顯示在儀表板上。 Carbon Footprint 的數據以千克 CO2 當量(kgCO2e)為單位,我們除了可在當中查看全年度及前一個月數據,更能透過圖表了解每月的總碳排放量,以及依使用服務、地區和 Project 區分的每月碳排放量。

©2022 Google Inc.
導出 Carbon Footprint 數據至 BigQuery
在介紹完 Carbon Footprint 的相關數據後,我們接著來嘗試把數據導入 BigQuery 。為此我們需設定 BigQuery 的權限,而導出 Carbon Footprint 數據至 BigQuery 所需的 Project 與 Billing Account IAM 權限分別如下。
Project IAM 權限:
• resourcemanager.projects.update
• serviceusage.services.enable
• bigquery.transfers.update
Billing Account IAM 權限:
• billing.accounts.getCarbonInformation
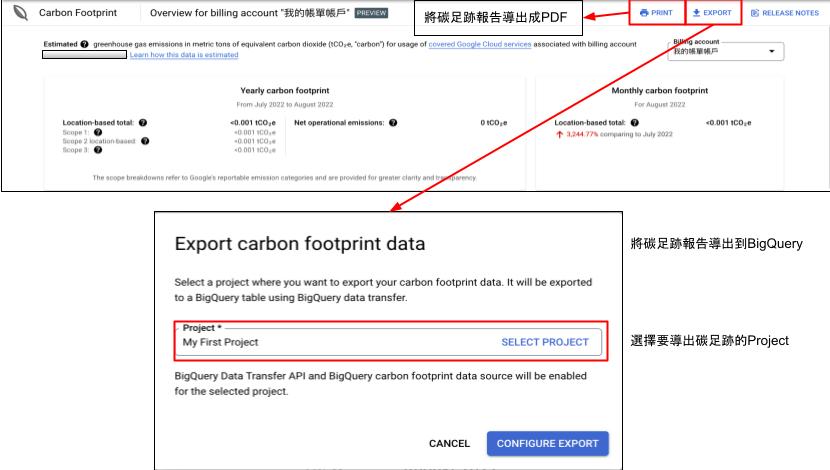
Carbon Footprint 會在下個月的第15天導出當月數據,但不會自動導出前幾個月的數據,所以我們必須安排數據回填才能將前幾個月的數據導出。要注意的是,剛創建好的 Carbon Footprint 導出排程無法立即將這個月的資料輸出,可以導出的最快時間需查看自動設定的時間排程。現在我們嘗試將 Carbon Footprint 數據輸出至 BigQuery。首先選擇要導出 Carbon Footprint 的 Project,這邊也可直接將儀表板的數據報告直接導出成 PDF 檔。
©2022 Google Inc.
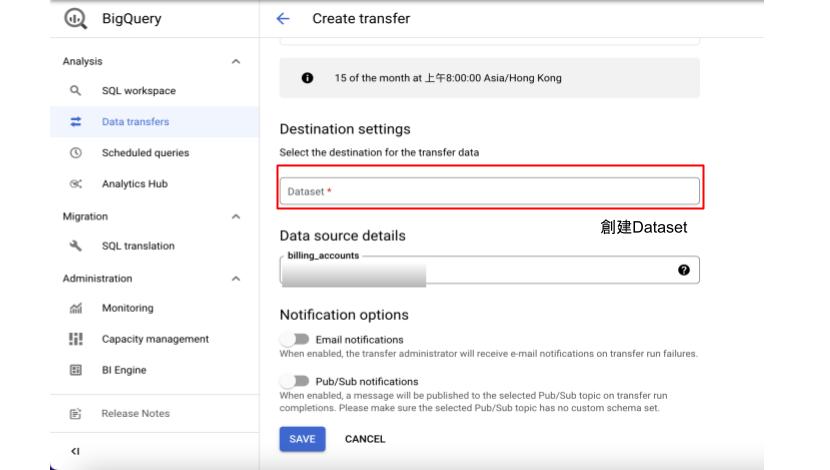
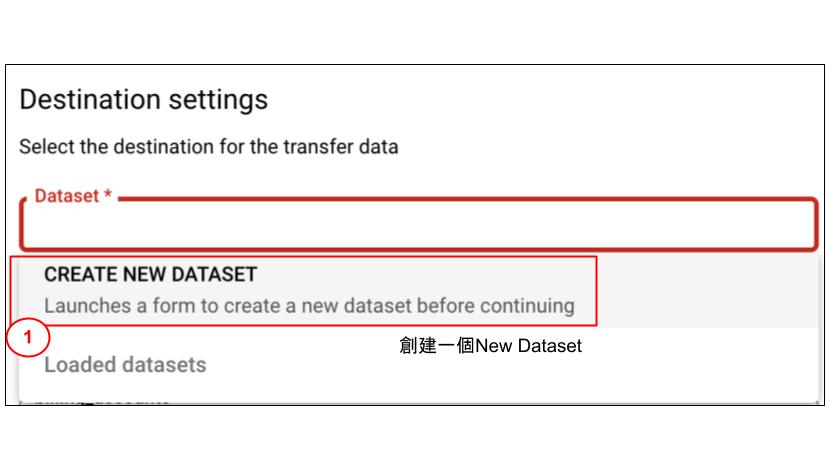
接著需要進行 Carbon Footprint 導入至 BigQuery 的相關設定。大部分的設定都會預設好,我們只需確定資料來源及設定檔都是 Carbon Footprint,並創建一個新的 Dataset 即可。

©2022 Google Inc.
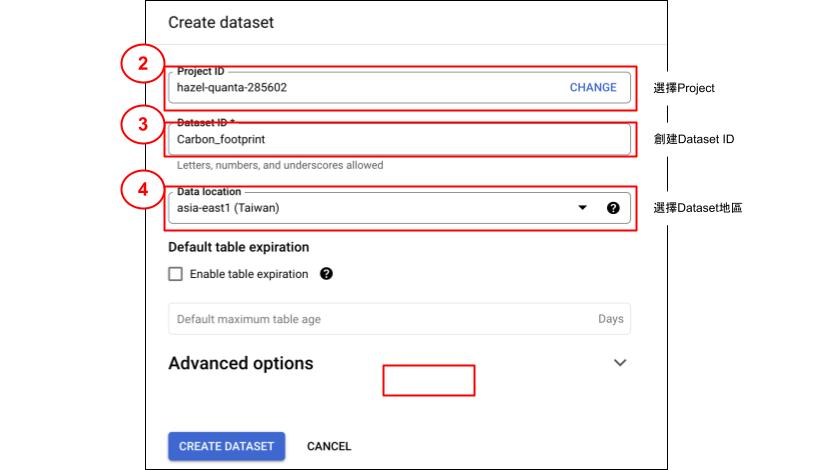
創建 Dataset 時,首先我們需確定所選的 Project、Dataset ID 及 Region 是否正確,接著就可賦予帳號相關權限,只需2個步驟就可完成導出的相關設定,對使用者而言非常的方便。

©2022 Google Inc.
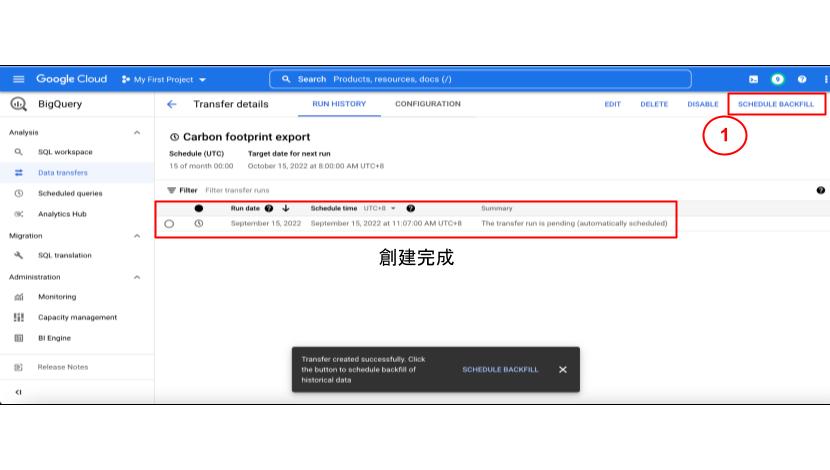
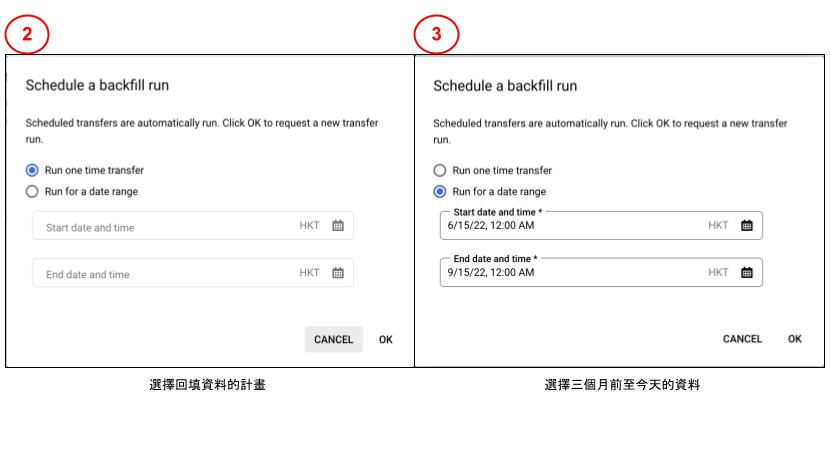
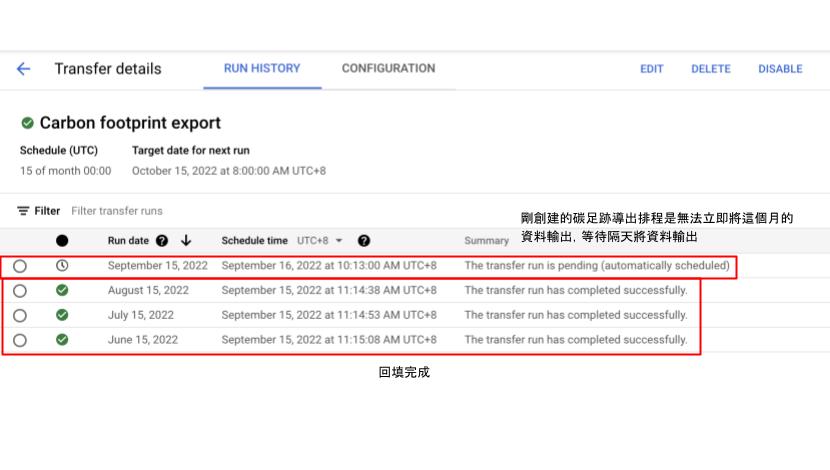
再來我們要做的就是將過去的資料主動回填並等待新的資料填入,新的資料填入最快需約一天的時間。以下為各位示範回填三個月前至今的 Carbon Footprint 資料,回填完成的資料狀態列會出現勾勾,目前未能輸出的資料則會出現時鐘圖示。
©2022 Google Inc.
資料完成填入後我們就可以在 BigQuery 裡看到先前創建的 Carbon Footprint Dataset,以及當中的相關數據。

©2022 Google Inc.
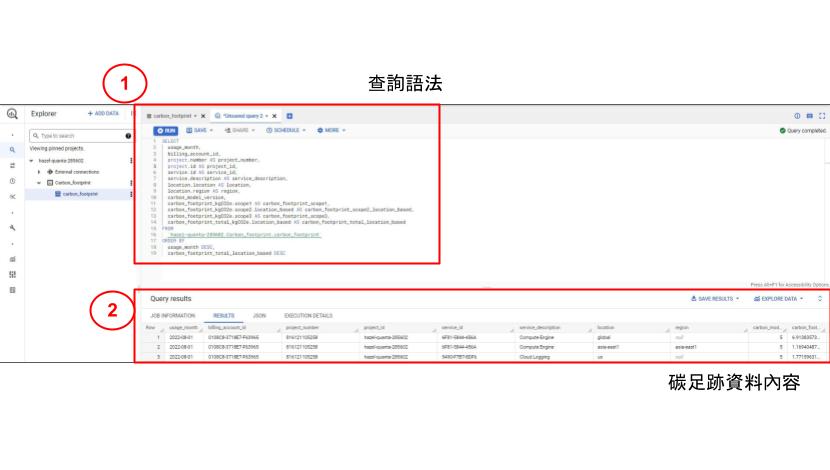
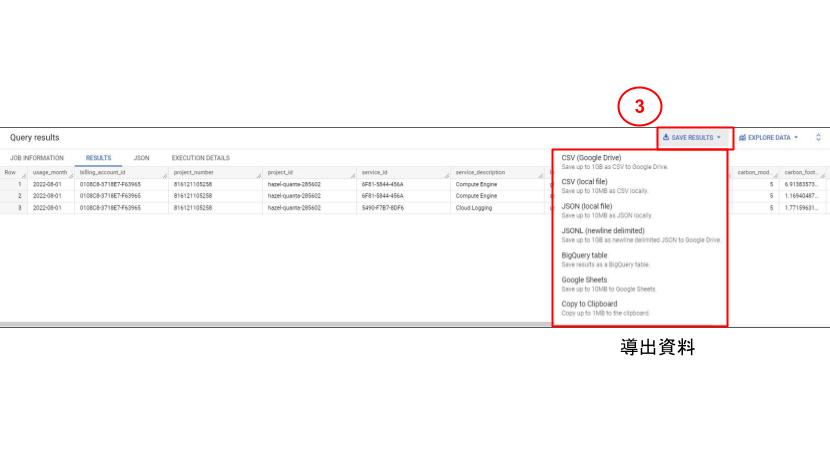
再來只要使用語法就能查詢並導出所需的數據。這裡示範將所有數據列出後,再把數據從 BigQuery 導出並印製成報告。BigQuery 提供眾多的報告格式,例如常見的 CSV 和 JSON,此外也能讓數據直接顯示在 Google Sheet 上,使用者可自行選擇方便使用的格式匯出報告。
©2022 Google Inc.
此次示範的查詢語法如下:
SELECT
  usage_month,
  billing_account_id,
  project.number AS project_number,
  project.id AS project_id,
  service.id AS service_id,
  service.description AS service_description,
  location.location AS location,
  location.region AS region,
  carbon_model_version,
  carbon_footprint_kgCO2e.scope1 AS carbon_footprint_scope1,
  carbon_footprint_kgCO2e.scope2.location_based AS carbon_footprint_scope2_location_based,
  carbon_footprint_kgCO2e.scope3 AS carbon_footprint_scope3,
  carbon_footprint_total_kgCO2e.location_based AS carbon_footprint_total_location_based
FROM
  `PROJECT.DATASET.carbon_footprint`
ORDER BY
  usage_month DESC,
carbon_footprint_total_location_based DESC以表格及圖表自動紀錄 Carbon Footprint 資料
除了直接導出資料,BigQuery 也讓 Looker Studio 和 Google Sheet 可同步顯示 Carbon Footprint 中的數據及圖表,如此一來,我們就算不開啟 Carbon Footprint 介面也能隨時掌握碳排放量數據,加快相關資料的整理速度。

©2022 Google Inc.


©2022 Google Inc.
除了直接將所有 Carbon Footprint 的數據匯出,我們也可依據需求,只導出所需資料至 Looker Studio 或 Google Sheet 來製成表格或圖表。以下示範使用語法篩選需要的資料,並將其導出與同步至 Google Sheet 。過程中我們只要了解 BigQuery 的語法使用,就能輕鬆將所需數據同步至表格,不需其他繁瑣的步驟。


©2022 Google Inc.

©2022 Google Inc.
Google 從 2007 年開始落實碳中和, 目前致力在2030年前實現無碳目標,藉由協助使用者善加利用 Google Cloud,來與合作夥伴一同達成無碳目標。其中,Carbon Footprint 這項工具可協助使用者追蹤、評估、回報及減少雲端服務的碳排放量,並免費提供碳排放報告與減碳建議,讓使用者能距離無碳目標更近一步。

這次簡單介紹了 Carbon Footprint,以及如何將當中的數據導入至 BigQuery 的方法。 Carbon Footprint 除了易於使用,搭配上 BigQuery 強大的分析功能後,更能輕鬆將所需的數據導出並繪製成易於觀看的圖表或表格,幫助企業達成碳中和的目標。如想了解更多關於Carbon Footprint 及 BigQuery 的使用歡迎與我們聯繫,讓我們協助您規劃雲端架構並實現碳中和。
▋延伸閱讀:
・BigQuery 是什麼?大數據時代一定要認識的最強資料分析工具
・BigQuery 教學―操作界面與分析、視覺化步驟完整圖解
・BigQuery SQL 語法基本操作 part 1
・BigQuery 串接 Google sheet 及 Looker Studio(原 Google Data Studio) 視覺化功能教學